
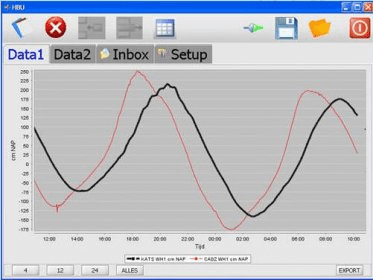
The HBU is a Hymedis client application that allows users to view and present Hymedis information in the form of graphs and data. It allows users to select combinations of parameters from different tabs, and once a connection is established, the latest data is collected from the central server in Vlissingen every minute. The graphical data presentation displays the last 24 hours of data, which can be zoomed in or out to view the conditions over the last 4 hours.
The HBU is an Hymedis client application that allows you to present the Hymedis information on graphs and as normal data. Different Hymedis parameters can be presented as graphs or as updated data.
In different tabs a user can select parameter combinations and, when a connection is established, every minute the latest data is picked up from the central server in Vlissingen. At the moment a graphical data presentation has been made, the latest 24 hrs data is retrieved from the central database. A user can zoom in/out on the graph, by presenting the condition over the latest 4 hrs, 12 hrs or 24 hrs. Predictions can also be shown in the 48 hrs mode. In this case the history is presented over the last 24 hrs and predictions on e.g. water levels are presented over the next 24 hrs. The graphs are also updated on a minute basis.
Additionally to parameter data presentation for multiple locations, inbox messages allow you to follow the latest news




Comments